| Causes and Effects of New Migration Patterns: The Industrial Revolution era (c. 1750–c. 1900 |
Introduction
Objectives: Explain the main push and pull factors that caused new migration patterns during industrialization. Calculate basic population changes and mortality rates in key migration flows using historical data. Map major migration routes and show how steamships, railroads, and canals made them faster and bigger. Debate whether migration was mostly voluntary opportunity or forced/coerced exploitation in different cases. Describe the main short- and long-term effects of mass migration on cities, countryside, and societies.
Imagine this: In the quiet fields of rural Lancashire or the green hills of Ireland around 1800, life moved to the rhythm of seasons, hand tools, and family hearths. A farmer might never travel farther than the nearest market town.
Then the machines roared to life.
Coal-fired engines thundered in factories. Steamships sliced oceans faster and cheaper. Rail lines snaked across continents like iron veins.
Suddenly, the world seemed smaller and millions were uprooted.
Between 1750 and 1900, industrialization didn’t just build cities; it emptied countrysides and flooded them with people desperate for wages. In Britain alone, Manchester exploded from a market town of 40,000 in the late 1700s to over 300,000 by mid-century, then nearing 2 million by 1900. It was swelled by rural migrants fleeing land scarcity, enclosures, mechanized farms; along with famine refugees from Ireland.
In 1847, “Black ’47”: Coffin ships crammed with starving Irish families crossing the Atlantic. Over a million fled the potato blight and colonial policies that turned blight into catastrophe. One million more died at home. Those who survived the voyage arrived in New York or Liverpool thin, feverish, and telling stories of ghost villages and “ghost ships” where children were born and buried at sea.
Across the globe, Chinese coolies endured brutal voyages to build railroads in Peru or plantations in Cuba. Indian indentured workers replaced enslaved labor in British colonies after abolition. Europeans poured into American factories, Australian goldfields, and Argentine plains, all drawn by promises of jobs, land, or escape from poverty.
These weren’t gentle shifts; they were seismic. Families were torn apart, ethnic enclaves rose in smoky tenements causing backlash from the native populations, money flowed back to empty villages. Cities became cauldrons of both opportunity and misery, troubled by cholera epidemics and child labor. Fortunes were made and lives were crushed.
This unit dives straight into that chaos: the causes that pushed and pulled people across maps, the effects that redrew societies, economies, and the very face of the planet.
Question everything: Was this mass movement the engine of modern progress or one of history’s greatest human upheavals?
Session 1: Session 1: “Fields Empty, Factories Fill – The Great Rural Exodus”
Why did millions abandon ancestral farms for smoky cities?
Millions fled ancestral farms for smoky cities (1750–1900) due to brutal push and pull factors; a storm of economic shifts, population booms, and industrial lures.
Key Pushes (forced out of rural areas)
- Enclosures & Land Grabs: Landlords fenced off commons for big farms; smallholders lost livelihoods, spiking rural joblessness.
- Agricultural Revolution + Population Surge: Better farming displaced workers; Europe’s population doubled (e.g. Britain 1750 to 1850), creating land shortages and surplus kids to feed.
- Rural Job Collapse: Handcrafts (such as weaving) died against factory machines.
Key Pulls (drawn into urban areas)
- Factory Wages: Manchester/Leeds mills needed unskilled labor; steady cash beat seasonal farm pay.
- Urban Promise: Cities offered escape, progress buzz; early rails/canals eased travel.
- Boom Cycle: Factories grew, pulling more migrants. Britain went from 17% urban (1801) to 72% (1891).
Reality:
Desperation often trumped choice. Cities meant slums, disease, and higher death rates, but rural ruin left no options.

Activity 1: New England’s Drop and Surge
New England map: Draw arrows from rural sources (central MA hills, Connecticut Valley farms, Vermont/NH uplands) to Boston sink. Mark railroads (post-1830s), mills (e.g., Lowell), ports. Add immigration routes (from Ireland/Europe via ships).
Session 2: “Famine Fires the Exodus – Ireland’s Ghost Ships”

The Irish Potato Famine (1845 to 1852), also known as the Great Hunger, was a devastating environmental and economic catastrophe triggered by the potato blight (Phytophthora infestans) that repeatedly destroyed Ireland’s staple crop. A population heavily dependent on potatoes, exacerbated by colonial land policies, absentee landlordism, export of other foodstuffs, and inadequate British relief, faced mass starvation and disease. Roughly 1 to 2 million people died from hunger and related illnesses, while another 2 million emigrated in one of the most intense transatlantic migration waves of the 19th century, primarily to the United States, Canada, and Britain. Ireland’s population plummeted from about 8.5 million in the early 1840s to roughly 4.4 million by the early 1850s, more than half its pre-famine size, marking one of the sharpest demographic collapses in modern European history.
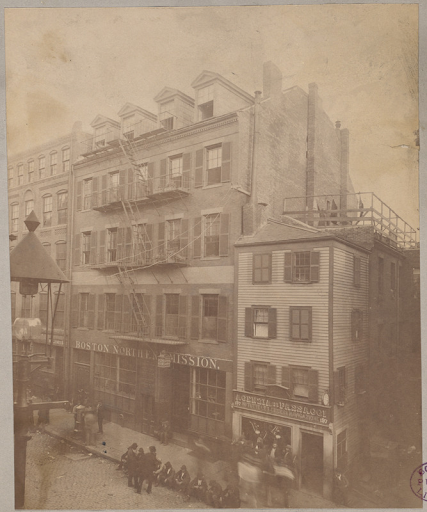
This crisis was not isolated; it reflected broader demographic pressures building across Europe and parts of Asia in the early industrial era, where rapid population growth met fragile food systems and unequal land distribution. The famine accelerated chain migration: emigrants sent remittances home to fund further family departures, creating self-sustaining networks. In American cities, especially Boston, New York, and Philadelphia, the arrival of hundreds of thousands of Irish refugees reshaped urban landscapes, forming tight-knit Irish-Catholic enclaves in neighborhoods like Boston’s North End. These communities fueled industrial labor (mills, docks, railroads), sparked nativist backlash (“No Irish Need Apply”), and laid the foundations for long-term Irish-American political and cultural influence.

Activity 2: “Crisis to Crossroads: Building the Famine Timeline”
Create a dynamic, annotated timeline that shows how the potato blight escalated into mass death/emigration, then trace its direct effects on Boston’s population boom and industrial growth. Include some causation (push factors), scale/numbers, geography (routes/ports), and human cost (effects on migrants and the receiving city).
Some items for the timeline:
Emigration remains high (around 150,000 to 200,000 leave).
- 1848
- Chain migration kicks in (relatives send prepaid tickets)
- Boston/New York ports are overwhelmed
- Irish form ethnic enclaves (e.g., North End in Boston)
- (1847 – “Black ’47”)
- Blight returns
- seed shortage means only around 25% of land planted
- Crop small but healthy, yet famine rages (evictions skyrocket, soup kitchens close)
- Deaths from starvation/disease surge
- Emigration explodes: around 250,00 to 300,000 flee Ireland total (many to U.S./Canada)
- Boston spike: around 37,000 Irish arrivals in one year (about a 30% one-year pop boost for city from approximately 115,000 to approximately 150,000)
- “Coffin ships” notorious; many die en route or at quarantine (e.g., Deer Island station in Boston Harbor)
- Nativist backlash grows (“No Irish Need Apply”).
- (1852)
- Potato recovery
- official end of Great Hunger
- Total toll: approximately 1 million dead and around 1–2 million emigrated
- population drops from about 8.5M to about 6.6M)
- Emigration continues high into 1850s/60s via chain networks
- Boston transformed from Yankee Protestant hub to diverse, Irish-Catholic powerhouse (roots of later political machines, e.g. Kennedy family ascent).
- (1849)
- Blight eases
- harvests improve with more imports
- Deaths drop but evictions/disease continue
- Emigration still massive (about 200,000+)
- Boston Irish-born population surges toward around 25–27% of city by mid-1850s.
- (1846)
- Blight hits harder and entire potato harvest fails
- Starvation spreads
- people eat grass, bark, diseased scraps
- British relief starts (public works, imports), but inadequate
- Emigration accelerates; “coffin ships” begin voyages (overcrowded, disease-ridden, high mortality)
- U.S. arrivals rise sharply.
- (1850–1851)
- Suffering drags on; more than 200,000 emigrate in 1851 alone (highest single year)
- Total famine-era emigration to U.S.: around 1–1.5 million (1845–1855)
- Boston: Irish make up between ¼ and 1/3 of population
- Irish fuel industrial labor (mills, docks, railroads)
- Nativism peaks (Know-Nothing Party gains in majority politics 1850s).
- (1845 – First Failure)
- Summer: Potato crop appears healthy
- October harvest: Phytophthora infestans (blight fungus) destroys almost half of the crop
- November: Government commission reports widespread ruin
- Early signs of hunger
- emigration ticks up slightly as panic begins.
Session 3: “Coolies, Indentured, Convicts: The Dark Side of Global Labor”
Chinese Coolie Trade (to Americas/Plantations)
In the mid-19th century, amid industrialization’s insatiable demand for cheap labor on sugar plantations and railroads in the Americas (Cuba, Peru, U.S. West Coast), the Chinese coolie trade emerged as a brutal semi-coerced migration system.
Facing poverty, wars (Opium Wars, Taiping Rebellion), and famine in southern China, over 250,000 men were lured or kidnapped by recruiters, shipped in horrific “floating hells” across the Pacific, and bound to 5 to 8 year contracts with abysmal pay and slave-like conditions such as whippings, opium addiction, and high suicide rates.
This flow, peaking 1840s to 1870s, fueled capitalist expansion but exposed migration’s dark underbelly: racial exploitation replacing African slavery, sparking anti-Chinese backlash (e.g. U.S. Exclusion Act 1882) and reshaping demographics in places like Havana’s Chinatown.

Indian Indenture (Post-Slavery British Empire)
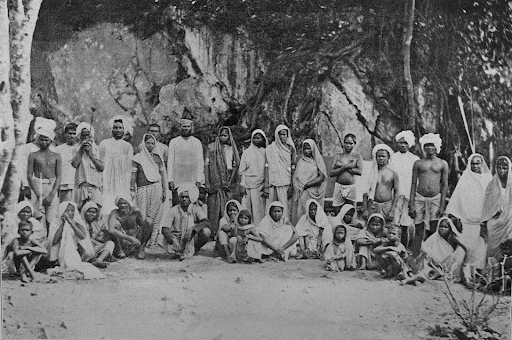
Post-1834 abolition of slavery in the British Empire, the Indian indenture system (1830s to 1920s) supplied over 1.5 million semi-coerced migrants from rural India to replace enslaved Africans on sugar, tea, and rubber plantations in the Caribbean (Guyana, Trinidad), Fiji, Mauritius, and South Africa.
Driven by colonial famines, caste oppression, and poverty under British Raj taxes, recruits signed 5-year “girmits” (agreements) promising wages but endured kangani or arkati recruiter deceptions, brutal voyages (high mortality), and plantation kangaroo courts with floggings and debt bondage.
This migration, often called “a new system of slavery,” powered imperial economies amid industrialization’s commodity boom but fractured families, created diaspora communities (e.g. Indo-Caribbeans), and ignited resistance like Gandhi’s early activism.
Australian Convict Transportation
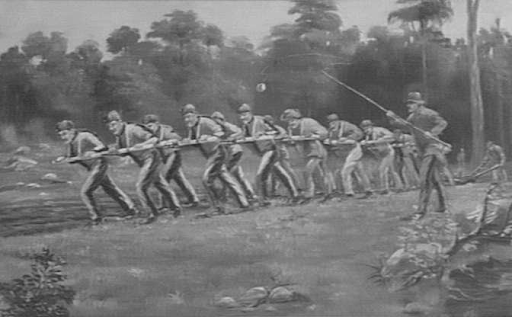
From 1788 to 1868, Britain’s convict transportation to Australia shipped over 160,000 coerced migrants, mostly petty criminals, from overcrowded industrial-era prisons in England and Ireland, to build colonial infrastructure amid empire’s expansion.
Pushed by urbanization’s poverty, enclosures displacing rural folk, and harsh laws (e.g, stealing bread could lead to 7 years in prison), convicts endured 6 to 8 month voyages in chains, then assigned labor on farms, roads, or quarries under the “assignment system” or brutal chain gangs.
This flow, peaking 1820s to 1830s, transformed penal colonies into settler societies (e.g. Sydney’s convict-built harbors fueling wool exports), but at human cost: family separations, floggings, and secondary punishments like Norfolk Island’s hellish isolation.
Session and Activity 4: “Voyage of the Damned: Crunching the Deadly Numbers”
- Australian Convict Transportation
- Source: McDonald & Shlomowitz, “Mortality on Convict Voyages to Australia, 1788–1868” (Social Science History, 1989)
- Mortality on Convict Voyages to Australia, 1788-1868
- Pages to read:
- 290–292 (overview of average mortality rates and period trends)
- Table 1 on p. 288 (voyage-by-voyage or summary averages).
- Chinese Coolie Trade
- Source: “Beyond Chinese ‘Coolies’ as Victims” (Migrant Knowledge blog, 2021)
- Beyond Chinese “Coolies” as Victims
- Sections to read:
- “Imagining the Coolie Victim” paragraph (death rates for Cuba/Peru voyages).
- Source: “The Voyage of the ‘Coolie’ Ship Kate Hooper.
- The Voyage of the “Coolie” Ship Kate Hooper, October 3, 1857–March 26, 1858
- Sections to read:
- “The Voyage” paragraph (17% average 1857 to 58 Cuba; specific voyage 6% with 612/652 survived).
- “The Kate Hooper docked in Havana on February 12, 1858. The Chinese were the first ones to leave the ship. Their eight-year indentures were sold for eighty dollars each. Of the 652 men who boarded in Macao, 612 survived the voyage. Thirty-eight died on the voyage, which included the five who were killed as a result of the revolt. The mortality rate for this voyage was a remarkable 6 percent. The average death rate of the coolie voyages to Cuba for the years 1857 and 1858 was 17 percent.”
- Indian Indenture
- Source: Hugh Tinker, A New System of Slavery (1974/1993)
- Pages to read:
- p.113 (early voyage mortality discussions, recruiter/ship horrors, and cited percentages).
Task: Pull Out Numbers & Calculate
- Read the assigned pages/sections above.
- Extract at least six mortality percentages (or death rates) from the text/tables:
Calculate survival percentage for each:
Survival % = 100 – Mortality %
- (If given as deaths per voyage, e.g., 612 survived out of 652 → survival % = (612 / 652) × 100)
- Fill this simple table:
Session 4: “Steamships & Rails: How Tech Turned Migration Mass”
Welcome to the engine room of your unit on the causes and effects of new migration patterns in the age of industrialization (c. 1750–1900). Up to now we’ve tracked the brutal human drivers pushing people off British land, famine driving Irish families across the Atlantic, colonial coercion funneling Indian and Chinese labor to distant plantations, convict ships hauling petty criminals to build Australia. Those were the pushes and the pulls. Now let’s zoom in on the machinery that made those migrations explode in scale, speed, and distance: steamships, railroads, and canals.
Before the 1830s, moving people long distances was slow, expensive, dangerous, and limited. A sailing ship from Liverpool to New York took 6 to 8 weeks and cost a small fortune for most workers; overland travel meant wagons, foot, or horse on muddy tracks. Then industrialization delivered three game-changers:
- Steamships (first reliable Atlantic crossings in the 1830s to 40s) slashed voyage times to 10 to 14 days, cut fares dramatically (especially steerage class), and carried thousands at once, turning “coffin ships” into mass-transit vessels for famine refugees and indentured workers.
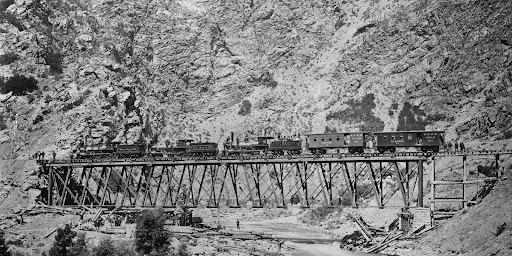
- Railroads (Britain’s network exploding after 1830, U.S. transcontinental push by 1869) let rural workers flood into industrial cities overnight and connected ports to inland factories/mines, pulling migrants hundreds of miles in hours instead of weeks.
Canals (Erie Canal 1825, Suez 1869) linked oceans and interiors, making bulk commodity exports profitable and creating migration corridors (e.g. Midwest grain to East Coast ports, then to Europe).

Activity: Causes and Effects of New Migration Patterns Quiz
Rubric for Causes and Effects of New Migration Patterns (c. 1750–1900)
| Activity | 1 – Needs Work | 2 – Developing | 3 – Good | 4 – Excellent |
| 1: New England’s Drop and Surge (Map) | Incomplete map, few/no labels or links | Basic map, some arrows/routes, labels unclear or missing | Main routes & labels shown, good effort, minor gaps | Accurate map, clear arrows/routes, all labels (railroads, mills, ports, immigration) |
| 2: Crisis to Crossroads (Famine Timeline) | Out of order, few annotations, missing key elements | Some order issues, partial annotations, basic link | Correct order, several annotations, solid flow | Chronological, well-annotated (push, numbers, routes, human cost) |
| 3: Voyage of the Damned (Mortality Calculations) | Few/no numbers, major errors, table missing | Fewer numbers or errors, incomplete table | 4–6 numbers, most calculations correct, table filled & basic comparison | 6+ accurate numbers extracted, all calculations correct (with work) |
| 4: Causes & Effects Quiz (20 MCQs) | <10 correct (<50%), major gaps | 10–13 correct (50–65%), some concepts missed | 14–17 correct (70–85%), good grasp | 18–20 correct (90%+), deep mastery |