| 9th Grade HIGHSCHOOL Unit 1 – Thinking Geographically |
| This is a Geography and History Project |
| Each Part is one theme day or 4 to 5 hours. |
| AP Human Geography introduces students to the systematic study of patterns and processes that have shaped human understanding, use, and alteration of Earth’s surface. Students employ spatial concepts and landscape analysis to examine human social organization and its environmental consequences. AP World History explains large-scale and long-term historical developments of regional, interregional, and global scope, and Analyzes ways in which human groups have come into contact and interacted with one another, including systems of communication, migration, commercial exchange, conquest, and cultural diffusion. |
Contents of Thinking Geographically (Areas of Study)
- Different types of maps and what they tell you
- How geographers collect and use data
- Spatial relationships and patterns
- Data analysis at different scales (for example, global, national, local)
- How geographers define regions
Part One – Different Types of Maps and What They Tell You.
“Maps are like campfires — everyone gathers around them, because they allow people to understand complex issues at a glance, and find agreement about how to help the land.”
There are many types of maps.
Each type of map tells you, the map reader, a different type of information.
Here is a non-exhaustive list of the types of maps and some information about them to glance through and/or explore.
- Political Map
- Physical Map
- Climatic Map
- Economic Map
- Resource Map
- Time Zone Map
- Road Map
- Topographic Map
- Weather Map
- Population Map
- World Map
- Geologic Map
- Cadastral Maps and Plat Maps
- Navigational Chart
- Other Maps
Task One – Map Language
Choose at least 3 types of map from the list (or others not on the list).
Research into each type.
Communicate about those maps in your own chosen method.
For example:
- oral presentation
- table
- poster / leaflet
- report
- table
You must include the following information:
- Type of map
- Typical usage (where, when, by whom)
- What information the map provides
- Why this type of map is used to provide this information
- What you understand about this kind of map and how useful you find it to be
Part Two – How Geographers Collect and Use Data
Geographic information is any information connected to a location that includes data about physical and human characteristics at any place on the planet.
The skills involved in acquiring geographic information include activities such as:
- locating and collecting data
- observing and systematically recording information
- reading and interpreting maps and other graphic representations of spaces and places
- interviewing people who can provide both information and perspectives about places and issues
- using statistical methods
- reading and interpreting all kinds of maps
- compiling and using primary and secondary information to prepare quantitative and qualitative descriptions
Geographers collect data from interviews, fieldwork, reference material, and digital resources.
Internet-based sources for geographic information are increasingly accessible but must always be evaluated for reliability and validity.
Primary sources of geographic information are important in geographic inquiry.
Fieldwork involves conducting research in the community by:
- distributing questionnaires
- taking photographs
- recording observations
- interviewing citizens
- collecting samples
Data collected using GPS technology in the field can be mapped onto digital maps and globes or viewed and analyzed in a GIS.
Typical secondary sources of information include:
- texts
- maps
- statistics
- photographs
- imagery
- video or multimedia
- databases
- newspapers
- telephone directories
- government publications
Digital data may be highly specialized such as:
- real-time data
- physical and human statistical data
- remotely sensed data and images
Being able to acquire geographic information enables students to engage in doing geography by mastering the techniques and skills necessary to gather and record geographic information and data from primary and secondary sources.
These sources aid in the acquisition of geographic information, especially from or about remote locations.
Encyclopedias report information compiled from secondary sources and are important in some research situations.
0:00 Introduction
0:20 Remote Sensing
0:34 Geographic Information System
1:04 Global Positioning System
1:29 Geospatial Technologies
1:40 Field Observations
1:59 Collecting Data
2:14 Media Reports
2:32 Travel Narratives
2:48 Government Documents
3:15 Personal Interviews
3:30 Landscape Analysis
4:08 Photo Analysis
4:16 Photo Analysis Example
5:01 Qualitative Data
5:32 Quantitative Data
5:53 Practice Quiz!
Task Two – Local Data
You have been invited to City Hall. The City of Bruno and Bruno Township want to make a bid for extra funds from Pine County. You need to help them to work out what kinds of bids they could make based on the data that you find.
You will find both Quantitative data (numbers-based, countable, or measurable) and Qualitative data (interpretation-based, descriptive, and relating to language).
Collect at least two different types of data about your town and choose an appropriate way to present each type.
The data you find could include:
- Quantitative (number based). For example: income, house value, age ranges, demographics.
- Weather / temperature ranges / trends.
- Reviews.
- Questionnaire data i.e. satisfaction.
- GPS Co-ordinates of a particular point or the GPS co-ordinates of the corners of an area.
- Topographical data
The methods of presentation could include maps, diagrams, charts, or graphs. Here are some simply explained examples.
Some data sources for you:
https://censusreporter.org/profiles/16000US2708290-bruno-mn/
https://en.wikipedia.org/wiki/Bruno_Township,_Pine_County,_Minnesota
https://www.lakesnwoods.com/Bruno.htm
http://www.city-data.com/township/Bruno-Pine-MN.html
https://www.citydirectory.us/city-bruno-minnesota.html
https://www.niche.com/places-to-live/bruno-township-pine-mn/
https://firstandsold.com/places-to-live/bruno-mn/
https://data.census.gov/all?q=Bruno+city,+Minnesota
https://datausa.io/profile/geo/bruno-mn
https://www.bestplaces.net/cost_of_living/city/minnesota/bruno
Part Three – Spatial Relationships and Patterns
Geographers, among others, are becoming interested in a kind of thinking called spatial thinking.
Spatial thinking underlies map reading.
Spatial thinking is defined as ‘the knowledge, skills, and habits of mind to use:
- concepts of space
- tools of representation like maps and graphs
- processes of reasoning to organize and solve problems
(Downs and de Souza 2005).
Quick Task
Draw a map of the local town from memory. Add as many details as you can. Think about what is where and why it is there. Check your map against the real town and take note of what you remembered and didn’t remember and why that might be.
There are five key geographic skills:
- Asking geographic questions
- Questions about geographic location:
- Where is it?
- Why is it here or there?
- How much of it is here or there?
- Questions about geographic distribution:
- Is it distributed locally or globally?
- Is it spatially clustered or dispersed?
- Where are the boundaries?
- Questions about geographic association:
- What else is near it?
- What else occurs with it?
- What is absent in its presence?
- Questions about geographic interaction:
- Is it linked to something else?
- What is the nature of this association?
- How much interaction occurs between the locations?
- Questions about geographic change:
- Has it always been here?
- How has it changed over time and space?
- What causes its diffusion or contraction?
- Questions about geographic location:
- Acquiring geographic information
- Organizing geographic information
- Analyzing geographic information
- Answering geographic questions
The First Law of Geography, according to Waldo Tobler, is “everything is related to everything else, but near things are more related than distant things.”
Task Three – Connections
This diagram shows how the United States are connected to each other geographically by borders.

Choose one of the following activities:
1. Create a connection diagram (or model) showing how one of the following collections of geographical spaces are connected to each other.
- The counties in Minnesota.
- The countries of the Americas.
- The countries of Africa.
- The townships in Pine County.
2. Create a connection diagram of 10 people in your family/friendship group and use it to prove (or disprove) the First Law of Geography. When you consider the ways in which they are connected you could consider things like (if you don’t know these things find out or use other things that you do know):
- Location – where they live and / or work.
- Relationships to each other – family / friend / neighbour etc…
- Where they shop.
- Where they go out to eat / drink.
- Whether they have children and where those children study.
- Interests / hobbies i.e hunting, cars, cooking etc…
- Ethnicity.
- Kind of things they eat i.e. vegan, meat etc…
- Languages they speak.
The idea is to see if any patterns emerge based on how closely connected people are.
Part Four – Data analysis at different scales (for example, global, national, local)
Scales & Distances
Four Types of Scales of Analysis
The 4 most common types of scales of analysis in Human Geography are:
>>Local
Local Scale
Definition:
The local scale refers to a specific community, town, city or region. It’s more detailed than larger scales, focusing on specific issues relevant to that area.
Analogy:
If the national scale is like viewing your country from an airplane, then local scale is like walking through your neighborhood. You can see individual houses, people, trees – all those details that make up your immediate environment.
Related Terms:
Urbanization: This refers to the process by which towns and cities are formed and become larger as more people begin living and working in central areas.
Infrastructure: These are basic physical structures needed for an area to function properly such as roads, bridges, water supply etc.
Cultural Landscape: This term refers to modifications made by humans on natural landscapes reflecting their culture.
>>National
National Scale
Definition:
The national scale refers to the level of geography that describes and analyzes spatial phenomena and variations across an entire nation.
Analogy:
Think of a national scale like viewing your country from an airplane. You can see the whole landscape, but you might not be able to make out individual houses or streets. It gives you a broad overview.
Related Terms:
Federalism: This is a system where power is divided between national and state governments.
Gross Domestic Product (GDP): This measures the total value of goods produced and services provided in a country during one year.
Demographics: These are statistical data relating to the population and particular groups within it on a national level.
>>Regional
Regional Scale
Definition:
The Regional Scale involves analyzing geographic data within distinct areas characterized by certain unifying features such as climate, culture, language, etc., which could be part of one country or span multiple countries.
Analogy:
Studying geography at regional scale is like reading chapters in a book where each chapter focuses on a different theme or character. Each region has its unique story, but they all contribute to the overall narrative.
Related Terms:
Cultural Region: An area defined by unique cultural characteristics such as language, religion, or customs.
Physical Region: A geographical area characterized by certain physical features like climate type, landforms, or vegetation.
Functional Region: A region defined by a particular set of activities or interactions that occur within it. For example, the coverage area of a delivery service
>>Global
Global Scale
Definition:
The Global Scale refers to an examination of geographic data or phenomena at a worldwide level.
Analogy:
Imagine watching Earth from space – that’s what it’s like studying geography at the global scale. You’re looking at patterns, processes, and trends that affect the whole planet.
Related Terms:
Globalization: The process by which businesses or other organizations develop international influence or start operating on an international scale.
World Systems Theory: A theory suggesting there is a world economic system in which some countries benefit while others are exploited.
Global Network: A network that spans across continents connecting people, companies, or governments around the world.
Local (Ex: City with supermarkets highlighted)
The local scale of analysis refers to the level of a particular community or neighborhood. It is a relatively small scale that focuses on issues and problems that affect a specific place or group of people.
Examples of issues that might be studied at the local scale include:
- Environmental impacts of a proposed development or land use change in a particular community
- Access to health care services in a particular neighborhood
- Crime rates and public safety in a particular area
- Quality of schools and educational opportunities in a particular community
National (Ex: A country color coded based on religion)
The national analysis scale describes the level of a specific country or nation. It operates on a larger scale than local government and focuses on problems and issues that affect the entire country or a substantial portion of it.
A few examples of issues that can be studied at the national scale include:
- Economic policies and their impact on different sectors of the economy
- National security and defense issues
- Healthcare policy and access to healthcare services
- Environmental regulations and their impact on the environment and industries
- Education policy and access to educational opportunities
Regional (Ex: Map of schools across a state)
The term “regional scale of analysis” describes a level of a specific region or geographical area that is larger than a single community or neighborhood but smaller than the entire nation. It can range in scale from a few nearby cities to an entire state or province.
Some examples of issues that might be studied at the regional scale include:
- Transportation and infrastructure needs in a particular region
- Environmental impacts of resource extraction or industrial development
- Access to healthcare and other services in a particular region
- Economic development and job creation in a particular area
Global (Ex: World Map of COVID-19 Cases by variant)
The level of the entire planet, as well as the global scale of systems and processes, is referred to as the global scale of analysis. It includes issues and problems that have a global or regional impact.
Examples of issues that can be observed at the global scale include:
- Climate change and its impacts on the environment and society
- Loss of biodiversity and the impacts on ecosystems
- Global economic inequality and poverty
- Global governance and international relations
- Access to healthcare, education, and other services in developing countries
The involvement of international organizations, as well as that of national governments, corporations, nonprofits, and other stakeholders, is frequently necessary to address problems on a global scale.
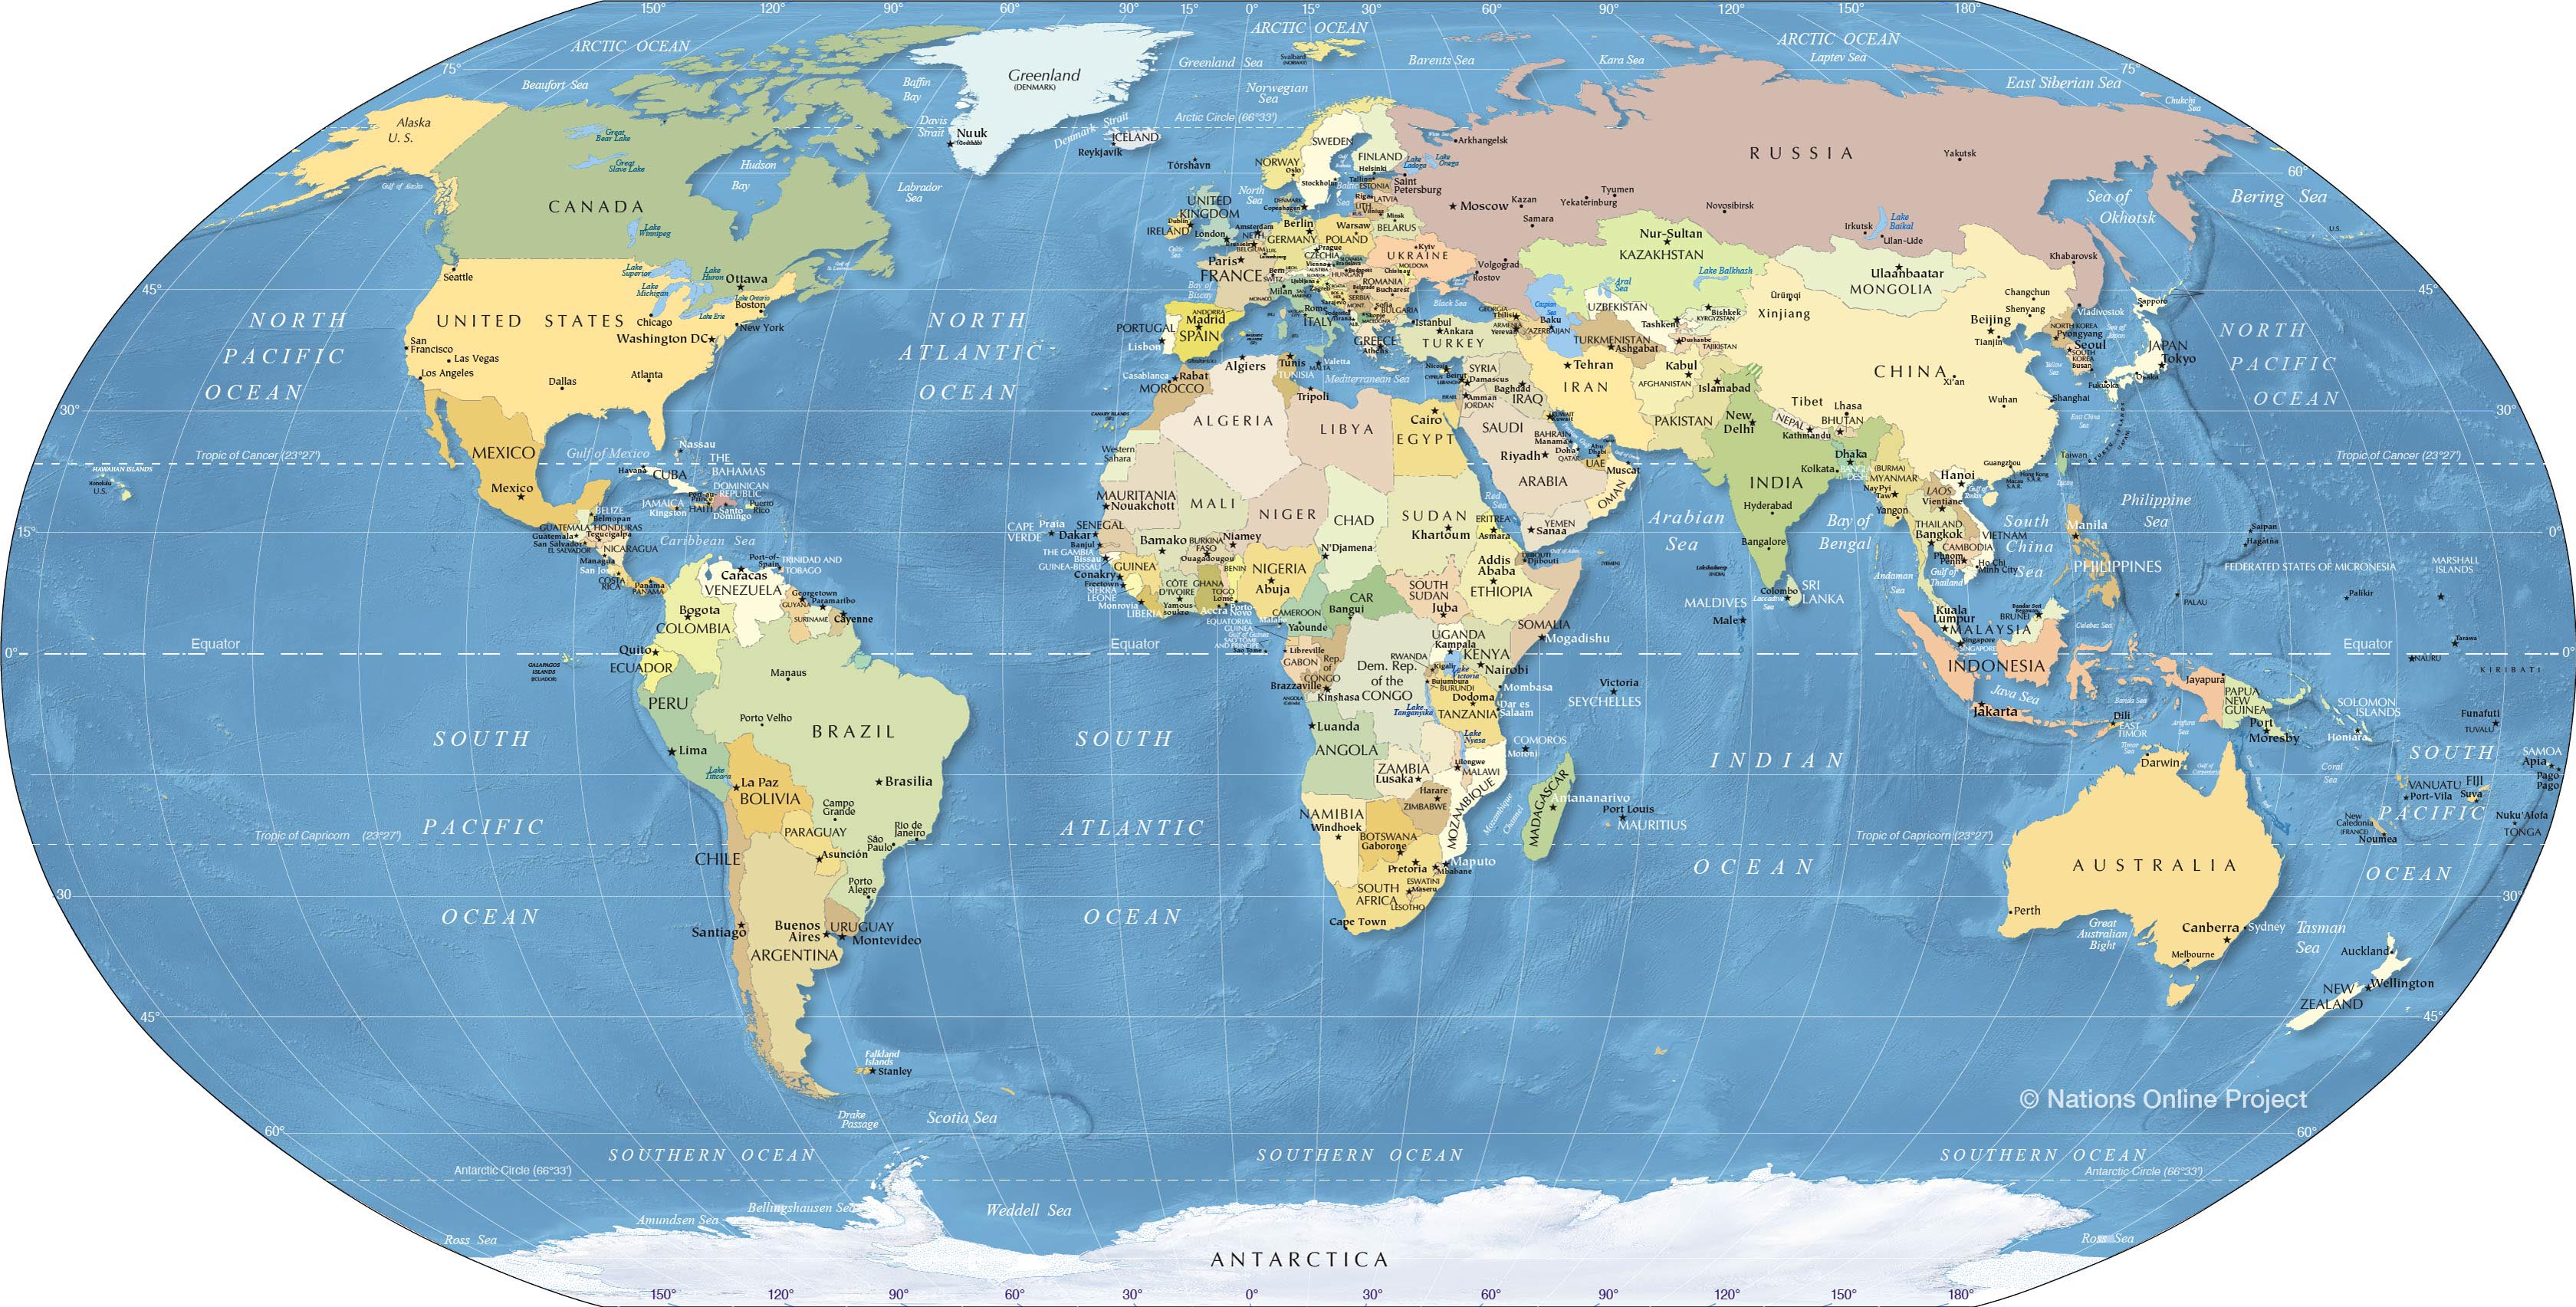
Maps can be created at many different scales, and the appropriate scale depends on the purpose of the map and the area being mapped.
A map of the entire world would typically be created at a smaller scale than a map of a single city, because the area being mapped is much larger.
A map that is focused on a specific theme or subject, such as religion or supermarkets, would be created at a different scale than a map that is intended to show a broader range of information.
information from: https://library.fiveable.me/ap-hug/unit-1/scales-analysis/study-guide/zPWCwxiBXe7fiUXv0szO
Task Four – Scales of Analysis
Find an example of each of the four types of map. Each one should address an issue.
Here are some resources:
https://livingatlas.arcgis.com/en/browse/#d=2
Global Maps
https://earthobservatory.nasa.gov/global-maps
https://www.globalincidentmap.com/
National Maps
https://apps.nationalmap.gov/viewer/
https://www.weather.gov/forecastmaps
Regional Maps
https://www.cia.gov/the-world-factbook/maps/world-regional/
Local Maps
https://360earthview.com/aerial-maps/
For each map:
- State the analysis scale of the map (local, national, regional, global)
- Identify the issue that the map addresses.
- Identify who might be involved at addressing the issue at that scale (members of the community, local government, national level government agencies, businesses, non-profit organizations, international organizations, multiple levels of government, community groups, national governments, corporations)
Part Five – How geographers define regions
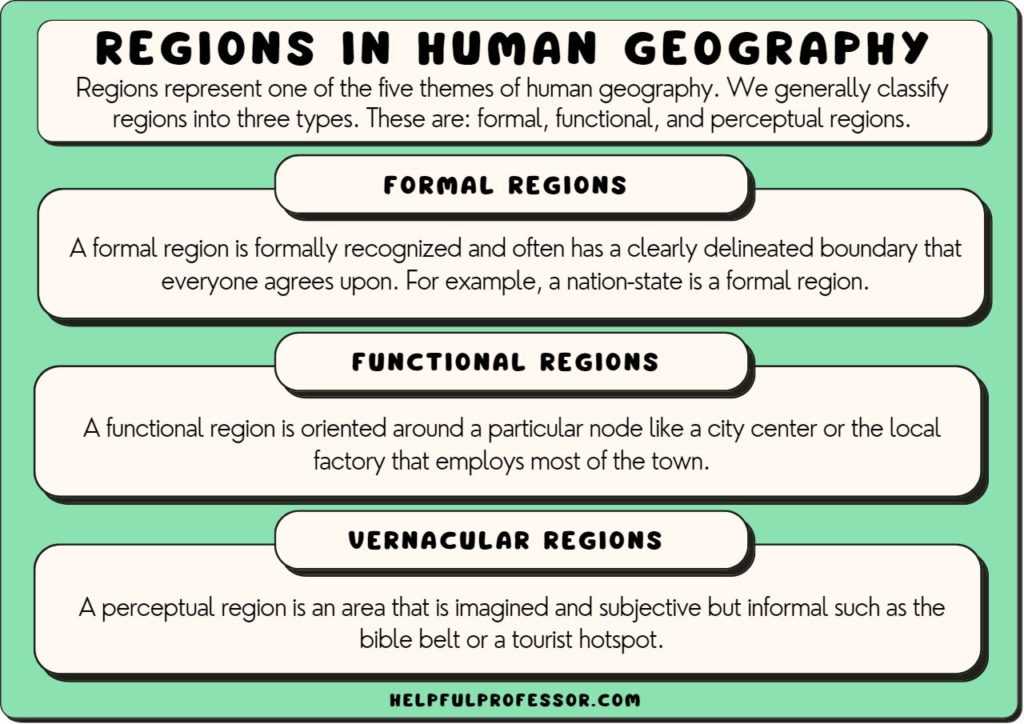
Geographers recognize three types of regions.
A formal region (or homogenous, uniform) is formally recognized and often has a clearly delineated boundary that everyone agrees upon. The people in the same region may share a language, religion, nationality, political identity, or culture. It can also be characterized by a common physical property, such as the presence of a type of climate, landform, or vegetation.
Examples of formal regions:
- The Rocky Mountain region
- The Corn Belt
- Latin America
- A nation-state
- Formal Regions of the USA
A functional region (or nodal) is oriented around a particular node like a city center or the local factory that employs most of the town, with surrounding areas linked by transportation systems, communication systems, or other associations such as manufacturing and retail trading.
Examples of functional regions:
- Chicago, with its highways, railways, Great Lakes shipping, airlines, and telecommunications, is a focal point in the north-central region of the United States.
- A business district.
- The States
A perceptual (or vernacular) region is an area that is imagined and subjective but informal such as the bible belt or a tourist hotspot. It is based on human feelings and attitudes about areas and is defined by people’s shared subjective images. These spatial units may be without precise borders or even commonly accepted regional characteristics and names.
Examples of perpetual regions:
- Southern California
- Dixie
- The Riviera
- Australian Outback
- The USA
information from: https://helpfulprofessor.com/types-of-regions/ and https://www.nationalgeographic.org/standards/national-geography-standards/5
Task Five – Regional Changes
Choose, research, and answer one of the following three questions.
Present your findings with visual aids in any appropriate manner. This could include hand drawn maps, screen shots, written notes, presentation or movie. You decide.
- Describe and explain how the formal regional boundaries and names of US territories and states have changed over time. Watch this.
- Describe and explain the changes in regional boundaries and names of African states during colonization and after independence in the nineteenth and twentieth centuries. Watch this.
- Describe and explain how the transition of ethnic groups moving in or out of city neighborhoods results in changes in the names, boundaries, and characteristics of the neighborhoods. Watch this about Little Italy in NYC.
“A map is the greatest of all epic poems. Its lines and colors show the realization of great dreams.” Gilbert H. Grosvenor