Stem-and-Leaf Plots
Here are the ages of some people taking a painting class.
77 80 82 68 65 59 61 57 50 62 61 70 69 64 67 70 62 65 65 73 76 87 80 82 83 79 79 71 80 77
Group the ages by the tens on each line, putting them in size order like this:
50 57 59
61 61 62 62 64 65 65 65 67 68 69
70 70 71 73 76 77 77 79 79
80 80 80 82 82 83 87
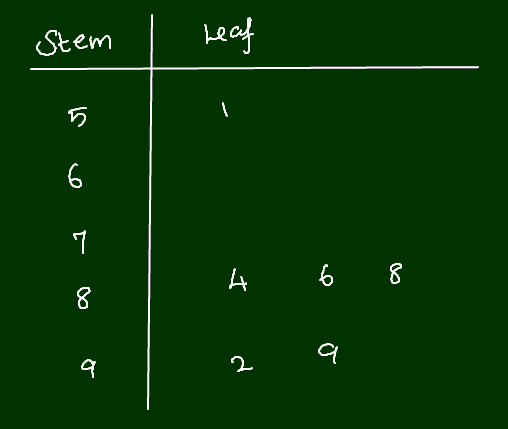
- Make a two column chart called “Art Ages.”
- Label the left column (the stem) as “Tens”
- Label he right column as “Ones”
- Beginning with the lowest number, or in this case, 50, enter a 5 in the tens column and a 0 in the ones column.
- For the next lowest temperature, 57, write a 7 in the ones column to indicate that one instance of 57 occurred.
- Then proceed to the next-lowest temperature of 59 and write a 9 in the ones column
- Once you have completed the 50s row move to the next row and add a 6 in the tens column and a 1 in the ones column.
- Continue until you have added all of the numbers to the chart.
Art Ages |
|
|---|---|
| Tens | Ones |
| 5 | 0 7 9 |
| 6 | 1 1 2 2 4 5 5 5 7 8 9 |
| 7 | 0 0 1 3 6 7 7 9 9 |
| 8 | 0 0 0 2 2 3 7 |
To find the median:
- Count all ages, which in this case is 30.
- Divide 30 by two, giving 15.
- Count either up from the lowest age of 50 or down from the highest age of 87 until you get to the 15th number in the data set, which in this case is 70.
- This is your median value in the data set.
